STEAM Network: Fostering a Collaborative Network - Part 1

STEAM Members Collaborate Regardless of Inaugural Year
Innovation and creative problem-solving occurs outside interdisciplinary silos through interactions across diverse talents and expertise. Luckily, for scholars looking to expand the scope of their work, the STEAM Factory at The Ohio State University provides a space where researchers from all disciplines can broaden their perspectives, share resources, spark creative research ideas and form collaborations across areas of common interest.
Studying the intricacies of the STEAM network alongside fellow undergraduate student, Milly Mason, has been a great pleasure. Along with Dr. Katherine O’ Brien, and Dr. Sathya Gopalakrishnan, we have analyzed features such as collaboration by scientific discipline, type of collaboration, cohort activity by year of entry, and utilized communal algorithms and animation to further breakdown activity and interdisciplinary efforts.
Data Collection Methodologies
Our research is based on two surveys conducted within the STEAM Factory in 2017 and 2019, representing about 120 of the 200 members. To ensure privacy we assigned each STEAM member a unique value and tracked their activity according to their corresponding primary key. A culture of collaboration and innovation was evident in 2017 via Figures 1A and 1B as we see STEAM members collaborating across years in great frequency. Visualizing this complex network of over 200 members has enabled our team to gain insight into trends that have taken place within the network in 2017 and 2019. We have been using RStudio as it is able to construct networks seamlessly by incorporating the vertices and edge data as members of the network with subsequent compilation into a data frame.
Activity Colored by Year of Entry
An important part of the data that we explored is the behavior of members based on the year they joined the STEAM Factory. We were curious if members had a tendency to collaborate with those who joined the network in the same year or within 1 to 2 years of their entry. Investigating this feature is important as it gives an indication into the behaviors and tendencies displayed by members of the network. Factors such as number of connections and centeredness in the network indicate how active different inaugural years have been as communities.
2017 survey distinguished by year of entry into STEAM
1A. 1B.
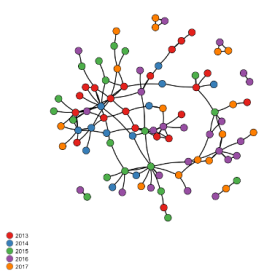
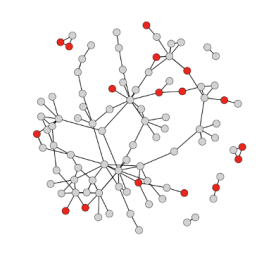
Figure 1A/B. Both visualizations portray the state of the STEAM Factory network as of 2017. Figure 1A shows the network segmented by the year each member joined. Figure 1B highlights new members (those that joined in 2017) in red.
The 2017 survey data, representative of 93 collaborating members, supplies a great first look into the self-reported activity of members in the STEAM Factory network. A trend we notice is that a community that consists primarily of members who joined the STEAM Factory in 2013 and 2014 exists alongside a community of primarily 2016 and 2017 members. This could indicate a tendency to collaborate with scholars that STEAM members may have known or worked with prior to joining or early in their tenure at the factory. Additionally, in figure 1B, new members who joined the network in 2017 are highlighted in red. They generally tend to lie on the outskirts of the network but appear to already be trending towards high amounts of collaboration in their first year. Proximity by year of entry may be correlated in this iteration of the network, which our team will continue to explore down the line. Regardless, this first view of the STEAM Factory in 2017 indicates encouraging trends.
2019 survey distinguished by year of entry into STEAM
2A. 2B.
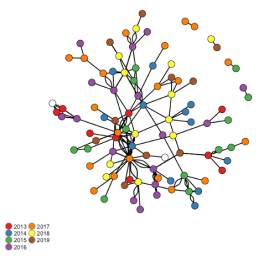
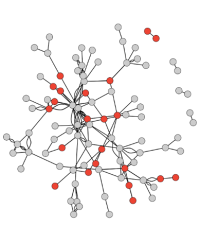
Figure 2A/B. Both visualizations portray the state of the STEAM Factory network as of 2019. Figure 2A shows the network segmented by the year each member joined. Figure 2B highlights new members (those that joined in 2019) in red.
The 2019 network visualization (Figure 2A/B) offers an advanced look into the progression of the STEAM Factory. If you were to say that these visualizations look like a completely random compilation of dots and colors, I wouldn’t disagree with you! Examining the intricacies exhibited by this visualization, we noticed many points of value. The widespread collaboration between members of different years is evident in this iteration of the network. While contributions from members of every year are evident, especially active members appear to have joined in 2016, 2017, and 2018. This finding shows a shift from 2017, suggesting that the STEAM Factory is a dynamic network with member’s highest periods of activity within 2-3 years of joining the network. Additionally, new members having joined in 2018 and 2019 are highlighted once again on the right side in red. New members continue to show promising collaborative trends, slowly working their way to the center of the network. This is a continuation of our previous findings and supports the hypothesis that highest activity may occur in years two and three. We are eager to continue exploring this phenomenon down the road as the network progresses. Data has already been collected from 170+ STEAM Factory members for 2020, and we are truly eager to examine how the network has developed since 2019.
The Best Part: The 2017 and 2019 data are indicative of several trends; but one of the most encouraging is that collaboration across years of entry has increased over time. It takes people about a year or two to form these connections, but they continue to add connections over time, maintaining a dynamic collaborative network.
About the Authors
Milly Mason is a Fourth Year Computer Science and Engineering Major with a minor in Statistics. Milly enjoys playing soccer and exploring with her dog. Milly will be working at Joby Aviation, an Air Taxi Start-Up after graduation as a Software Engineer.

Eamon McDonough is Third Year Information Systems Major with a minor in Design Thinking.
Outside of the classroom, Eamon is involved with CEO Club at Ohio State, Students Consulting for Nonprofit Organizations, and the Information Systems Association. In his free time, Eamon enjoys fitness, movies, travel, and spending time with friends and family.