STEAM Network: Going Further Together - Part 2

STEAM Communities Embody Interdisciplinary Collaboration
In studying the intricacies of interdisciplinary collaboration within the STEAM Factory, we further explore members’ collaborative communities within the STEAM Factory network. Members are placed into communities by complex algorithms and indicate trends within the network over time. In this edition we will elaborate on how the communities are created, why it matters, and what it means for the STEAM Factory going forward.
Network Animation Overtime
As the STEAM factory grew, so did the number of connections. Shown in the animation below, is a cumulative representation of the STEAM Network from 2010-2019. Currently, the animation is colored by discipline to the express the diversity of the network overtime. This dynamic visualization thoroughly demonstrates the progression of the structural integrity of the network. Not only does it progress due to the increased number of nodes, but one can follow the natural pull of isolated clusters into the main connection net. This animation was generated using the render.d3movie function in R with a dynamic network input parameter explicitly outlining the "activity" or time frame of each node and edge connection.
Community Detection Algorithm Methodology
Once the STEAM Factory membership grew in to the hundreds, it is impossible for every member to know every other member; within the network members formed collaborative communities. We utilized the 'cluster_fast_greedy' function in R to visualize communities of nodes within the graph in 2017 and 2019. The function utilizes node modularity and modularity scores to segment the nodes. Essentially, modularity is an algorithm that separates each data point and aims to find communities by directly optimizing a modularity score. The modularity score is based on the number of nodes and edges that are in the proximity of the data point in question. This algorithm has enabled us to take a deeper look into what STEAM interdisciplinary communities look like.
2017 community detection algorithm Fig.1 2019 community detection algorithm Fig. 2
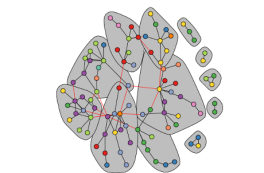
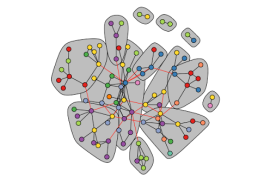
Figure 1. The above visualization displays an alternative representation of the STEAM Factory in 2017. Figure 1 utilizes a community detection algorithm that divides scholars into various communities, colored by discipline.
Figure 2. The above visualization displays an alternative representation of the STEAM Factory in 2019. Figure 2 utilizes community a detection algorithm that divides scholars into various communities, colored by discipline.
The 2017 community visualization illustrates the high variation present in the network. Some noteworthy statistics about the network are the 12 different communities along with a modularity score of .74, indicating an observable amount of separation between communities. Additionally, the most common discipline is engineering with 14 members in the network. Mathematics and physical sciences, education and human resources, and social and behavioral economics are all next with 12 members each. These four disciplines can be observed collaborating with nearly any other discipline in almost every community. Least common is medicine with four members, Environmental Research and Education with two members, and geography with one member. Integrative activities, social behavioral and economic sciences, and engineering seem to be three different disciplines that have a tendency to collaborate. Additionally, there are many instances of collaboration between unsimilar disciplines such as arts and engineering, education / human resources and mathematical and physical sciences. These collaborations are a point of success within the network as unsimilar disciplines work together to explore the unknown. We will continue to observe which disciplines and characteristics have a tendency to collaborate the most and what developments can be seen within the network.
The 2019 community visualization reflects promising trends within the STEAM Factory. For reference, the total number of communities increased from 12 to 13 and number of members responding to the survey increased from 93 to 95 between 2017 and 2019. Additionally, a decreasing modularity score of .68 indicates more apparent overlap as communities are less segmented as compared to 2017. These statistics point to an increase in connections between communities. There are many members in this set who belong to two communities as collaborations across communities have risen. There are 23 members who serve as points of connection between two different communities. Lastly, collaboration seems to have expanded beyond working within the same discipline, as the visualization reflects communities that include up to nine different scientific disciplines. We are very encouraged that the STEAM Factory is achieving its primary objective as members strive to expand the boundaries of conventional experimentation by working with various disciplines.
The Best Part: Overall, there has been an increase in collaborations and greater overlap between communities between 2017 and 2019, respectively. The STEAM Factory and its members have succeeded in creating an informal collaborative outreach model for universities around the world. We are enthralled by the work that has been done and look forward to analyzing node characteristics to better understand factors that drive network formation.
About the Authors
Milly Mason is a Fourth Year Computer Science and Engineering Major with a minor in Statistics. Milly enjoys playing soccer and exploring with her dog. Milly will be working at Joby Aviation, an Air Taxi Start-Up after graduation as a Software Engineer.

Eamon McDonough is Third Year Information Systems Major with a minor in Design Thinking.
Outside of the classroom, Eamon is involved with CEO Club at Ohio State, Students Consulting for Nonprofit Organizations, and the Information Systems Association. In his free time, Eamon enjoys fitness, movies, travel, and spending time with friends and family.